
Page 12 - ITAtube Journal 32022
P. 12
Market information
Figure 8: Global Supply Chain Bottlenecks, index, Source: Federal Reserve Bank of New York
beginning of 2022, the index has returned to normal values of around 1 this Novem- ber (Figure 8).
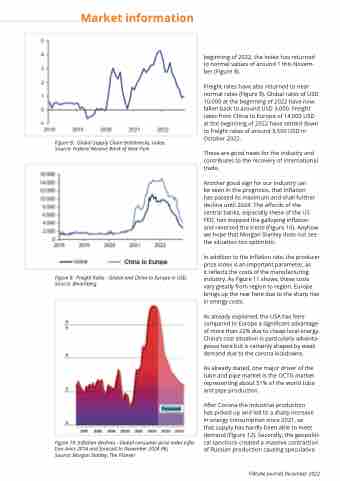
Freight rates have also returned to near normal rates (Figure 9). Global rates of USD 10,000 at the beginning of 2022 have now fallen back to around USD 3,000. Freight rates from China to Europe of 14,000 USD at the beginning of 2022 have settled down to freight rates of around 3,500 USD in October 2022.
These are good news for the industry and contributes to the recovery of international trade.
Another good sign for our industry can
be seen in the prognosis, that Inflation
has passed its maximum and shall further decline until 2024. The affords of the central banks, especially these of the US FED, has stopped the galloping inflation and reversed the trend (Figure 10). Anyhow we hope that Morgan Stanley does not see the situation too optimistic.
In addition to the inflation rate, the producer price index is an important parameter, as
it reflects the costs of the manufacturing industry. As Figure 11 shows, these costs vary greatly from region to region. Europe brings up the rear here due to the sharp rise in energy costs.
As already explained, the USA has here compared to Europe a significant advantage of more than 22% due to cheap local energy. China’s cost situation is particularly advanta- geous here but is certainly shaped by weak demand due to the corona lockdowns.
As already stated, one major driver of the tube and pipe market is the OCTG market representing about 51% of the world tube and pipe production.
After Corona the industrial production
has picked up and led to a sharp increase in energy consumption since 2021, so
that supply has hardly been able to meet demand (Figure 12). Secondly, the geopoliti- cal sanctions created a massive contraction of Russian production causing speculative
Figure 9: Freight Rates - Global and China to Europe in USD, Source: Bloomberg
Figure 10: Inflation declines - Global consumer price index infla- tion since 2016 and forecast to November 2024 (%),
Source: Morgan Stanley, The Pioneer
ITAtube Journal December 2022
