
Page 11 - ITAtube Journal 2 2022
P. 11
11.5% year-on-year, though recovering transportation demand may push May figures back above 14 million b/d.
At the peak of lockdown mandates, gaso- line and diesel demand in coastal regions dropped by as much as 40%, with a grand total of 45 cities with some form of move- ment restrictions.
Now, however, prices rose again. The oil and gas producing countries could cer- tainly have increased the supply volumes so that the energy prices would have fallen to a normal level. The refusal to increase supply sufficiently has been reflected in the balance sheets of energy producers. Aramco, the world’s largest producer of fossil fuels, has become the world’s most valuable company this first quarter 2022. Currently, there is no evidence that oil and gas producers are increasing supply to capture market prices. The USA anyhow significantly increases the number of rigs from 531 in May 2021 to 728 in May 2022 (Figure 5).
Of these 728 rigs, 576 are dedicated for the extraction of oil and 150 for gas. Canada at the same time increased their number of rigs by 30 to 88. Efforts to reduce depend- ence on fossil fuels can hardly be successful in the short term and can only contribute to decoupling in the medium term. For
our pipe industry, however, this means that high energy prices must be expected in the near future as well. Some analysts are anticipating another surge towards the $130-140 per barrel range this summer.
On the other hand, investments to secure the energy supply will keep the demand for tube products high.
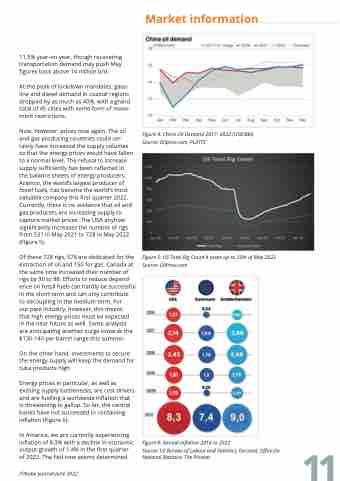
Energy prices in particular, as well as existing supply bottlenecks, are cost drivers and are fuelling a worldwide inflation that is threatening to gallop. So far, the central banks have not succeeded in containing inflation (Figure 6).
In America, we are currently experiencing inflation of 8.3% with a decline in economic output growth of 1.4% in the first quarter of 2022. The Fed now seems determined
Figure 4: China Oil Demand 2017- 2022 (US$/Bbl) Source: Oilprice.com, PLATTS
Market information
ITAtube Journal June 2022
Figure 5: US Total Rig Count 4 years up to 25th of May 2022 Source: OilPrice.com
Figure 6: Annual Inflation 2016 to 2022
Source: US Bureau of Labour and Statistics, Eurostat, Office for National Statistics, The Pioneer
11
