
Page 27 - ITAtube Journal 2 2022
P. 27
data M Sheet Metal Solutions GmbH
data M – First Company to Com- bine Measurement and Simulation Data on Single Platform
Press releases
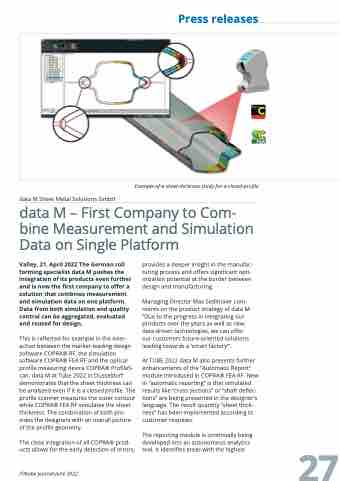
Example-of-a-sheet-thickness-study-for-a-closed-profile
Valley, 21. April 2022 The German roll forming specialist data M pushes the integration of its products even further and is now the first company to offer a solution that combines measurement and simulation data on one platform. Data from both simulation and quality control can be aggregated, evaluated and reused for design.
This is reflected for example in the inter- action between the market-leading design software COPRA® RF, the simulation software COPRA® FEA RF and the optical profile measuring device COPRA® ProfileS- can. data M at Tube 2022 in Dusseldorf demonstrates that the sheet thickness can be analyzed even if it is a closed profile. The profile scanner measures the outer contour while COPRA® FEA RF simulates the sheet thickness. The combination of both pro- vides the designers with an overall picture of the profile geometry.
The close integration of all COPRA® prod- ucts allows for the early detection of errors,
ITAtube Journal June 2022
provides a deeper insight in the manufac- turing process and offers significant opti- mization potential at the border between design and manufacturing.
Managing Director Max Sedlmaier com- ments on the product strategy of data M: “Due to the progress in integrating our products over the years as well as new, data-driven technologies, we can offer our customers future-oriented solutions leading towards a ‘smart factory’”.
At TUBE 2022 data M also presents further enhancements of the “Automatic Report” module introduced in COPRA® FEA RF. New in “automatic reporting” is that simulated results like “cross sections” or “shaft deflec- tions” are being presented in the designer’s language. The result quantity “sheet thick- ness” has been implemented according to customer requests.
The reporting module is continually being developed into an autonomous analytics tool. It identifies areas with the highest
27
