
Page 12 - VAK_Broschuere_II_18.indd
P. 12
12
Market information
advantage of the political meas- ures instituted by Mr. Trump.
Given that many oil-exploring countries have production costs ranging from 30-40 US$, it is unsurprising that the industry reacts with the utmost sensitivity to current oil price developments (Fig. 7).
Moreover, the entire shale gas exploring industry, regarded in 2014 as a highly attractive indus- try segment, saw itself forced by previously low oil prices to further reduce its cost level to about 24 US$/barrel (Fig. 7) – with the
result that its selling price is now much lower than the current price offered for crude oil by the market. In consequence, shale gas production was increased. It is to be expected that rising oil prices will affect a further shale gas boom.
The OPEC countries and some other partner countries such as Russia are currently reducing the oil volume offered to the world market by about 1.8 million barrels/day.
International Energy Agency (IEA) gures show it expects oil con-
sumption to increase this year by about 1.4 million barrels/day.
At the same time, it expects that non-OPEC countries such as the US will increase production by at least 1.7 million barrels/day.
Citigroup analysts are predicting a hike in output levels by non- OPEC producers of as much as 2.2 million barrels/day.
If the IEA and Citigroup are correct in their assumptions, the world could face an oversupply of oil, with attendant negative con- sequences for the tube and pipe industry. However, this oversupply could well be canceled out by the political sanctions initiated by the US government against Iran and Venezuela.
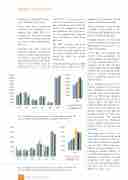
As a consequence of oil prices soaring, pumping of oil and gas and exploration activities were restarted. This had an immediate effect on OCTG pipe consump- tion, particularly in the US. Since January 2017, the pipe price index had climbed by about 36 %, or from 244 to 332 (Fig. 8). The positive signals in 2017 had also prompted traders to begin cau- tious restocking. The renewed boom in prices (77 US$/barrel by June 2018) continues to have positive effects on the tube and pipe index.
These pipe price corrections cer- tainly left their mark on the world steel pipe production (Fig. 9). 2016 was considered a no growth year. In 2017, global tube pro- duction increased slightly (1 %). Looking at regional statistics, it is notable that only China (-4 %) displayed a downturn in pipe production. All other regions increased their production gures (US +34 %, EU +12 %, CIS +13 %, ROW +9 %, India +5 %).
Fig. 11: World steel pipe production in Ttons (welded < 406 mm OD) Source: ITAtube Journal/Wirtschaftsvereinigung Stahlrohre e.V
Fig. 12: World Steel Pipe Production in Ttons (welded ≥ 406 mm OD) Source: ITAtube Journal/Wirtschaftsvereinigung Stahlrohre e.V.
ITAtube Journal No2/July 2018
