
Page 14 - ITAtube Journal 1 2022
P. 14
Market information
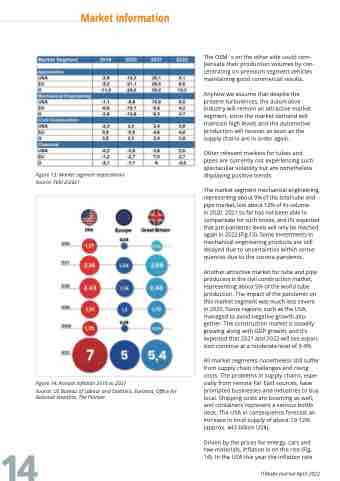
Figure 13: Market segment expectations Source: FERI 2/2021
The OEM´s on the other side could com- pensate their production volumes by con- centrating on premium segment vehicles maintaining good commercial results.
Anyhow we assume that despite the present turbulences, the automotive industry will remain an attractive market segment, since the market demand will maintain high levels and the automotive production will recover as soon as the supply chains are in order again.
Other relevant markets for tubes and pipes are currently not experiencing such spectacular volatility but are nonetheless displaying positive trends.
The market segment mechanical engineering, representing about 9% of the total tube and pipe market, lost about 12% of its volume
in 2020. 2021 so far has not been able to compensate for such losses, and it’s expected that pre-pandemic levels will only be reached again in 2022 (Fig.13). Some investments in mechanical engineering products are still delayed due to uncertainties within conse- quences due to the corona pandemic.
Another attractive market for tube and pipe producers is the civil construction market, representing about 5% of the world tube production. The impact of the pandemic on this market segment was much less severe in 2020. Some regions, such as the USA, managed to avoid negative growth alto- gether. The construction market is steadily growing along with GDP growth, and it’s expected that 2021 and 2022 will see expan- sion continue at a moderate level of 3-4%.
All market segments nonetheless still suffer from supply chain challenges and rising costs. The problems in supply chains, espe- cially from remote Far East sources, have prompted businesses and industries to buy local. Shipping costs are booming as well, and containers represent a serious bottle neck. The USA in consequence forecast an increase in local supply of about 10-12% (approx. 443 billion US$).
Driven by the prices for energy, cars and raw materials, inflation is on the rise (Fig. 14). In the USA this year the inflation rate
ITAtube Journal April 2022
Figure 14: Annual Inflation 2016 to 2021
Source: US Bureau of Labour and Statistics, Eurostat, Office for National Statistics, The Pioneer
14
