
Page 9 - ITAtube Journal 1-2021
P. 9
Market information
Many supply chains were disrupted and in consequence some production facilities were shut down. Pipe and tube prices went down by 4% in the first 3 quarters of 2020, sta- bilizing in the 4th quarter 2020 due to an increase in tube and pipe demand.
In 2021 the industry had an impressive restart, led by China and followed by other regions, particularly the USA and Europe. As a consequence, the need for energy supplies such as oil and gas ballooned, with direct implications for energy prices.
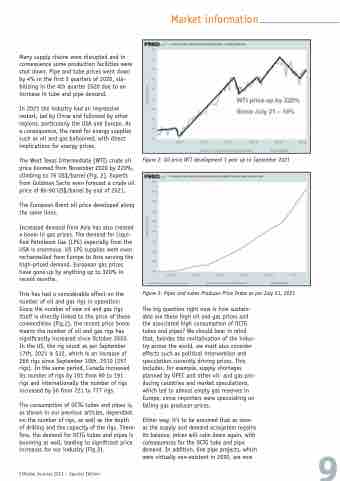
The West Texas Intermediate (WTI) crude oil price boomed from November 2020 by 220%, climbing to 76 US$/barrel (Fig. 2). Experts from Goldman Sachs even forecast a crude oil price of 80-90 US$/barrel by end of 2021.
The European Brent oil price developed along the same lines.
Increased demand from Asia has also created a boom in gas prices. The demand for Liqui- fied Petroleum Gas (LPG) especially from the USA is enormous. US LPG supplies were even rechannelled from Europe to Asia serving the high-priced demand. European gas prices have gone up by anything up to 320% in recent months.
This has had a considerable effect on the number of oil and gas rigs in operation: Since the number of new oil and gas rigs itself is directly linked to the price of these commodities (Fig.2), the recent price boom means the number of oil and gas rigs has significantly increased since October 2020. In the US, the rig count as per September 17th, 2021 is 512, which is an increase of 266 rigs since September 10th, 2010 (257 rigs). In the same period, Canada increased its number of rigs by 101 from 90 to 191 rigs and internationally the number of rigs increased by 56 from 721 to 777 rigs.
The consumption of OCTG tubes and pipes is, as shown in our previous articles, dependant on the number of rigs, as well as the depth of drilling and the capacity of the rigs. There- fore, the demand for OCTG tubes and pipes is booming as well, leading to significant price increases for our industry (Fig.3).
ITAtube Journal 2021 – Special Edition
Figure 2: Oil price WTI development 1 year up to September 2021
Figure 3: Pipes and tubes Producer Price Index as per July 31, 2021
The big question right now is how sustain- able are these high oil and gas prices and the associated high consumption of OCTG tubes and pipes? We should bear in mind that, besides the revitalisation of the indus- try across the world, we must also consider effects such as political intervention and speculation currently driving prices. This includes, for example, supply shortages planned by OPEC and other oil- and gas-pro- ducing countries and market speculations, which led to almost empty gas reserves in Europe, since importers were speculating on falling gas producer prices.
Either way, it’s to be assumed that as soon
as the supply and demand ecosystem regains
its balance, prices will calm down again, with
consequences for the OCTG tube and pipe 9 demand. In addition, line pipe projects, which
were virtually non-existent in 2020, are now
