
Page 11 - ITATUBE Journal 1 2020
P. 11
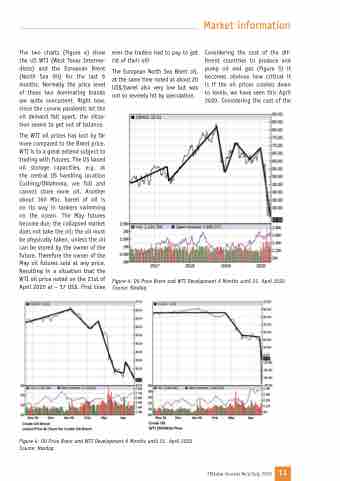
The two charts (Figure 4) show the US WTI (West Texas Interme- diate) and the European Brent (North Sea Oil) for the last 6 months. Normally the price level of these two dominating brands are quite concurrent. Right now, since the corona pandemic let the oil demand fall apart, the situa- tion seems to get out of balance.
The WTI oil prices has lost by far more compared to the Brent price. WTI is to a great extend subject to trading with futures. The US based oil storage capacities, e.g. at the central US handling location Cushing/Oklahoma, are full and cannot store more oil. Another about 160 Mio. barrel of oil is on its way in tankers swimming on the ocean. The May futures become due; the collapsed market does not take the oil; the oil must be physically taken, unless the oil can be stored by the owner of the future. Therefore the owner of the May oil futures sold at any price. Resulting in a situation that the WTI oil price noted on the 21st of April 2020 at – 37 US$. First time
ever the traders had to pay to get rid of their oil!
The European North Sea Brent oil, at the same time noted at about 20 US$/barrel also very low but was not so severely hit by speculation.
Considering the cost of the dif- ferent countries to produce and pump oil and gas (Figure 5) it becomes obvious how critical it is if the oil prices crashes down to levels, we have seen this April 2020. Considering the cost of the
Figure 4: Oil Price Brent and WTI Development 6 Months until 21. April 2020 Source: Nasdaq
Figure 4: Oil Price Brent and WTI Development 6 Months until 21. April 2020 Source: Nasdaq
Market information
    ITAtube Journal No1/July 2020
11
